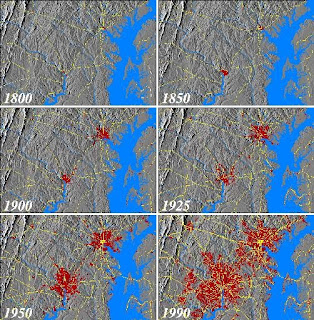
Cart Ca Cartographic animations are typically used to display the relations between geospatial data components and time. The goal of cartographic animation is to be able to visualize something that would not be seen if the maps were looked at individually.
The Un United States Geological Survey, the University of Maryland Baltimore County (UMBC), the National Aeronautics and Space Administration (NASA), and various local government agencies are cooperating to assemble a temporal database for the Baltimore-Washington regional area to study the effects of 200 years of human-induced change on the area. The data sets shown here are urban development, principal transportation routes, coastlines, topography, and hydrography.
http:/ www1.elsevier.com/homepage/sad/cageo/cgvis/acevedo/acevedo.htm

No comments:
Post a Comment