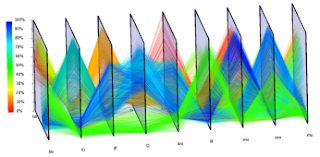
In the parallel coordinate plot, each variable is graphed on a vertical axis. A data element is plotted as a connected set of points, one on each axis. This is a 3D parallel coordinate view of all cells and nine selected genes. Spatial and gene expression information are clearly separated while the basic character of spatial gene expression patterns is preserved in one dimension.

No comments:
Post a Comment