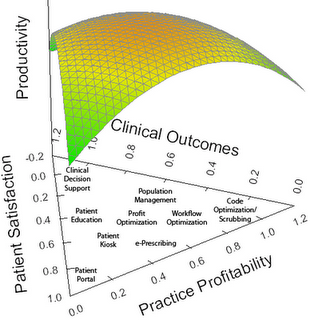
This is a 3D triangular plot that a blogger created to see how people interpreted it. Triangular plots relate 3, and in this case 4 variables. The middle of the plot shows where all 4 variables are equal. One reader responded with his interpretation saying that, " I understand that you have plotted three quite separate metrics that a practice should be striving to maximize, i.e.: Patient Satisfaction, Clinical Outcomes, and Practice Profitability. Some of the items listed on the graphic can promote one, two, or even all three of the metrics. E-prescribing and workflow optimzation are items that should impact all three, while code optimization really impacts only practice profitability."

No comments:
Post a Comment