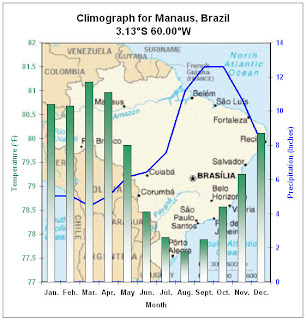
A climographs is a graphic representation of the relation between temperature and precipitation as plotted at monthly intervals throughout the year.
The blue lines show temperatures in degrees F on the left axis. The bars show precipitation in inches on the right axis. This is a climograph for Manaus, Brazil.
The blue lines show temperatures in degrees F on the left axis. The bars show precipitation in inches on the right axis. This is a climograph for Manaus, Brazil.

No comments:
Post a Comment