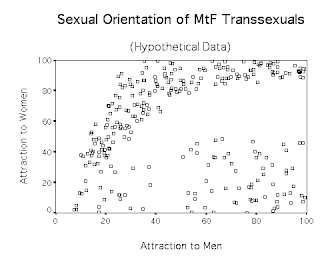
Scatter plots show the relationship between two variables by displaying data points on a two deminsional graph. Scatter plots can provide information about the relationship between the two variables including the strength, shape, and direction. This scatter plot shows the sexual orientation of transsexuals. The right bottom corner shows homosexual transsexuals and the upper left side shows non-homosexual transsexuals. The scale is 0 means no attraction and 100 is the highest possible level of attraction.

No comments:
Post a Comment