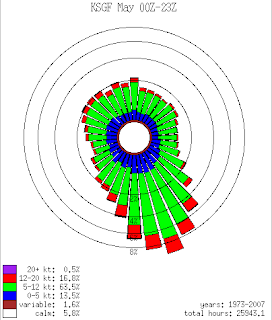
This is an example of a circular plot. It shows the frequencies of different wind directions in the month of May from 1973 through 2007 in Springfield, MO. It is most common to display windroses using the direction the wind came from. Most often windroses are displayed from 16 directions. However, to reduce bias created within windrose creation software, ME DEP Meteorologists are now using 36 direction windroses. As always each spoke provides information about wind speed as well. The website I found this windrose on had data from 3 counties for each month of the year.

No comments:
Post a Comment