Monday, November 30, 2009
Bilateral Graph

Nominal area choropleth map
Unstandardized Choropleth Map
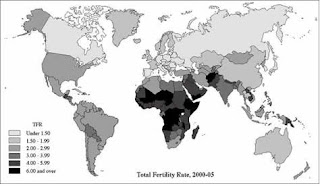 An unstandardized choropleth map is one that has not been areally averaged by density or percentages. This map shows the total fertility rate of the world.
http://www.eps.mq.edu.au/courses/GEOS219/choropleth.htm
Standardized choropleth map
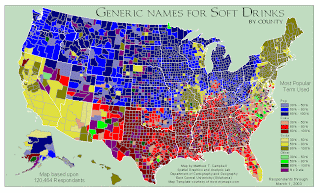
Univariate Choropleth Map
Bivariate Choropleth Map
Unclassed Choropleth Map
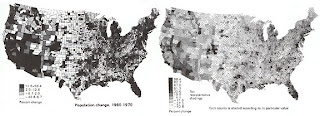
Classed Choropleth Maps
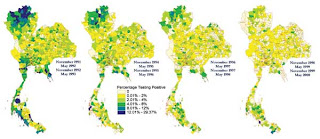
Sunday, November 29, 2009
Range graded proportional circle map
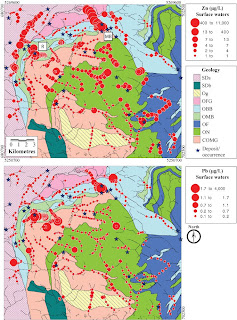 Range graded proportional circle maps use a set number of circle sizes to map point data. These are Proportional circle maps of Zn and Pb in surface waters of the Bathurst Mining Camp, New Brunswick, Canada. Also shown are deposits and showings/occurrences in the area of ~400 km2.
http://gsc.nrcan.gc.ca/mindep/method/geochem/index_e.php
Continuously variable proportional circle map
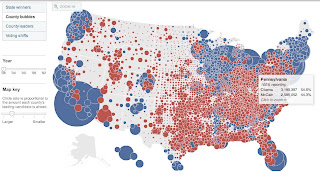
DOQQ
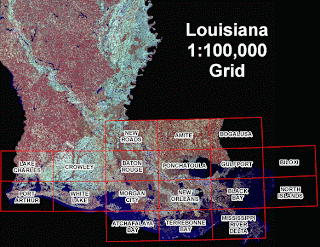
DOQQs (Digital Orthographic Quarter-Quads) combine the image characteristics of an aerial photograph with the geometric qualities of a map. DOQQs are orthorectified, which removes distortion out of aerial photos so that they can be used as flat maps, this allows for more accurate measurement of distance, areas, angles, and positions.
This is an image taken in 2005 of Louisiana after Hurricane Katrina and Rita hit. This photography extends from Gulfport, MS to Sabine Lake, LA and includes areas impacted by Hurricanes Katrina and Rita. Funding for the photography was provided by the Coastal Wetlands Planning, Protection and Restoration Act, Coastwide Reference Monitoring Program (CWPPRA - CRMS), with additional funding provided by the Louisiana Department of Environmental Quality and the U.S. Geological Survey to expand coverage to assist in hurricane recovery.
http://www.lacoast.gov/maps/2005doqq/
DEM
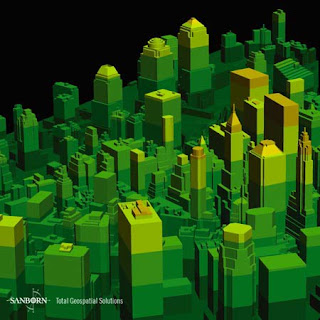
DEMs (digital elevation models) are digital files consisting of terrain elevations for ground positions at regularly spaced horizontal intervals. DEMs are in raster format, the cartographic data is recorded, stored, and processed in a cell, or pixel.
This is a DEM of New York City, NY on November 12, 2003.
http://www.sanborn.com/products/dems.asp
DLG
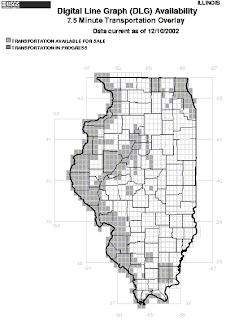
DLGs are digital vector representations of topographic and planimetric map features derived from either aerial photographs or from cartographic source materials, using manual and automated digitizing methods. DLGs contain a wide variety of information including topography, hydrography, political and administrative boundaries, roads, vegetative surface cover, etc.
This DLG file shows the transportation available for sale and the transportation in progress in Illinois.
http://pubs.usgs.gov/of/2003/of03-471/domier/index.html
DRG
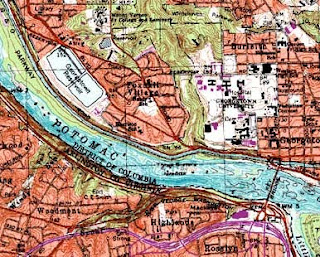
A DRG (digital raster graphic) is a scanned version of a U.S. Geological Survey (USGS) topographic map that also includes the collar information on the published map. DRGs are georeferenced to the Universal Transverse Mercator Projection and use the same datum as the published map, either NAD 27 or NAD 83. DRGs are available from many sources (some free and some for a fee) including state geospatial data clearinghouses, the USGS, and private companies that have business agreements with the USGS. USGS DRGs are available in scales: 1:250,000, 1:100,000, and 1:24,000.
http://egsc.usgs.gov/isb/pubs/factsheets/fs08801.html
Tuesday, November 17, 2009
Isopleths
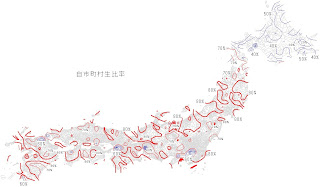
Isopleths are contour lines that join areas of equal value of the variable that is being measured. The distance between the contour lines depict the rate of change in that third variable. There are a variety of specialized isopleth maps. Examples include: , isohyets (show rainfall), isopachs (show rock or sediment), isotachs (show wind speed), and isobars (show air pressure).
This map uses isopleth lines to illustrate the proportion of people in Japan who have been living in single municipalities since birth.
Isopach
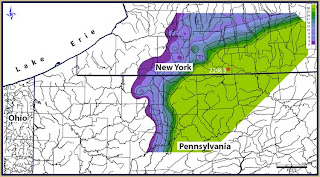 An isopach is a contour that connects points of equal thickness. Commonly, the isopachs that make up an isopach map display the stratigraphic thickness of a rock unit as opposed to the true vertical thickness. This is an isopach map of the Union Springs Shale (thickness in feet).
A cont
Isohyets
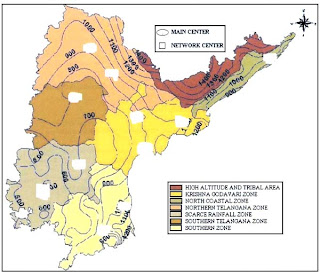 Isohyets are contour lines on a map or chart connecting areas of equal rainfall. The Acharya N.G. Ranga Agricultural University (ANGRAU) has initiated a project aimed at improvement of water management in the State of Andhra Pradesh, India due to the limited availabilty of water since 2000. This map shows the Agro-climatic Zones with annual Rainfall (mm) Isohyets of Andhra Pradesh.
Isotachs
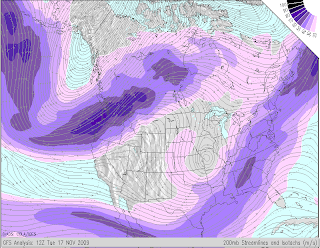 Isotachs are contour lines on a given surface connecting points with equal wind speed. This map shows 200 mb isotachs and streamlines.
- Purple shading indicates the speed of the winds at the 200 millibar level, in meters per second.
- The streamlines indicate the direction of flow of the wind, which is generally from west to east throughout most of the subtropics, mid- and high-latitudes.
- The color of the streamlines indicates a relative measure of divergence of the flow in the upper troposphere. Orange and red indicates strong divergence at upper levels, usually associated with strong vertical velocities in the middle troposphere, and severe weather/heavy rainfall.
Isobar
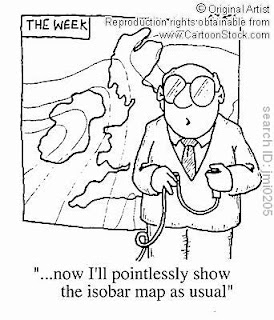
A line drawn on a weather map connecting points of equal pressure is called an isobar. The isobars are generated from mean sea level pressure reports and the pressure values are given in millibars. The image I found is a cartoon of a weather man showing an isobar map. I thought this related to our discussion about how much or how little weather reporters really know about what they are showing the audience.
A lin
Monday, November 9, 2009
LIDAR
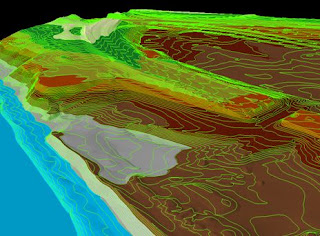 LIDAR can measure distance, speed, rotation, chemical composition and concentration. This image was produced by a laser beam fired at the ground from a plane to measure the distance to the ground and record the exact position of up to 85,000 points on the ground each second. This data is then used to make a 3-D map of the area.
In the specific case of forestry management, officials will have the ability to identify young forest canopies too dense or at risk for not maturing into fully-developed trees. Furthermore, they will also be able to calculate the heights of individual trees within one or two feet and, in some cases, identify the types of trees observed.
http://www.treehugger.com/files/2007/06/3-d_forest_mapping.php
Tuesday, November 3, 2009
Doppler Radar
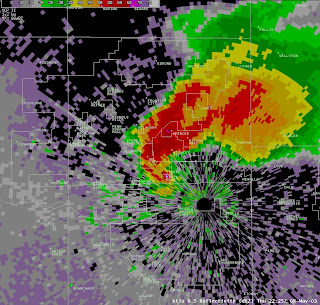 Doppler radars use the Doppler Effect to detect reflectivity and rotational velocity to predict weather and prevent catastrophes during severe storms. Reflectivity is a measure of the size of the particles in the air and rotational velocity is a measure of the speed and direction of the air relative to the radar station.
This is an image showing the hook echo of a F4 tornado as it hit the General Motors plant in Oklahoma City. As a result of NOAA sending out a tornado warning all 1,200 employees were safely evacuated.
http://www.noaanews.noaa.gov/stories/s2097.htm
Black and White Aerial Photo
Infrared Aerial Photo
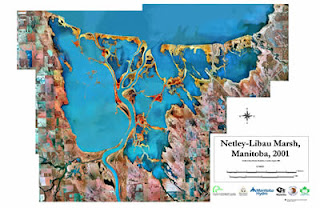
Infrared aerial photography is a powerful tool. Not only can it be used to document changes to the environment, the health of forests, wetlands, bays and oceans, but it can also be used to document and monitor such items as damage to roofs, the tracking of dairy farm out flows, pinpointing the source of, and monitoring, insect or disease infested vineyards, or sites contaminated by toxic chemicals, and many more applications. This is an infrared aerial photo of the Nteley-Libau Marsh in Manitoba a "Mecca" for the waterfowler, a migratory bird who's species is deteriorating.
