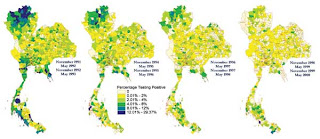
Choropleth maps portray areal data. In classed choropleth maps data is combined into a smaller number of groups and portrayed in intervals, usually 4 to 7 so that the pattern being shown is apparent and useful information is communicated. This classed choropleth map uses 6 intervals to show the percentage of Thai men that tested positive for HIV at time of entry into the Royal Thai Army, Thailand, 1991–2000.

No comments:
Post a Comment