Isopleths are contour lines that join areas of equal value of the variable that is being measured. The distance between the contour lines depict the rate of change in that third variable. There are a variety of specialized isopleth maps. Examples include: , isohyets (show rainfall), isopachs (show rock or sediment), isotachs (show wind speed), and isobars (show air pressure).
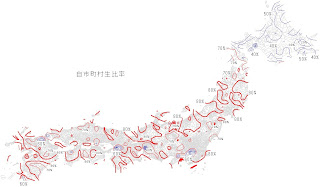
This map uses isopleth lines to illustrate the proportion of people in Japan who have been living in single municipalities since birth.
http://web.sfc.keio.ac.jp/~endo/historical_gis.htm

No comments:
Post a Comment